Portfolio Planning


Stop Drowning, Start Swimming with Jira
Most of our customers have implemented Jira (or a similar product), but, as they scale agile delivery, begin to struggle to make sense of what’s going on. Once scaled, life as someone looking after delivery can become a blur of epics, stories, burn down charts, retrospectives and debates about estimation.
It’s easy to lose sight of what you’re trying to achieve, by when. And even more importantly, how are you progressing towards your delivery targets?
In most cases, Jira is fit for purpose, you just need to implement some best practices around it.
In this blog we share some of our top tips to lift yourself out of the noise of day-to-day delivery, and up to delivery management.
Tip 1: Configure the basics consistently
Do you have a clear idea of how your teams should be using Jira? These rules should be methodology agnostic and simply encapsulate some basic ground rules. Our top five recommendations on setting up Jira are:
Define your main fields - create a basic list of fields that you would like your teams to use, and publish it. For example Summary, Epic Link, Description, Fix Version, Estimate… and any other custom fields that might be useful for your delivery.
Create a template of a good issue - and encourage your teams to duplicate it each time they create a new issue. This template can include placeholder guidance on what you want to see in each field.
Careful with custom fields - depending on the scale you’re operating at, we would also encourage you to implement some light governance to control the creation of new custom fields. Implementing light governance can help make sure you don’t spiral out of control capturing too much useless peripheral data against each issue.
Encourage a common currency - and make sure your team stick to it! If your delivery teams are talking in a common currency (i.e. the same data hierarchy/taxonomy) - it will save you a lot of time having to normalise at the portfolio level later.
In the diagram below, at least at the project and product level, you should agree with the language, and fields you will use. Perhaps you want to group your Epics into Work Packages… or use subtasks within your tasks. It doesn’t matter, just make sure you’ve agreed and circulated an agreed hierarchy.
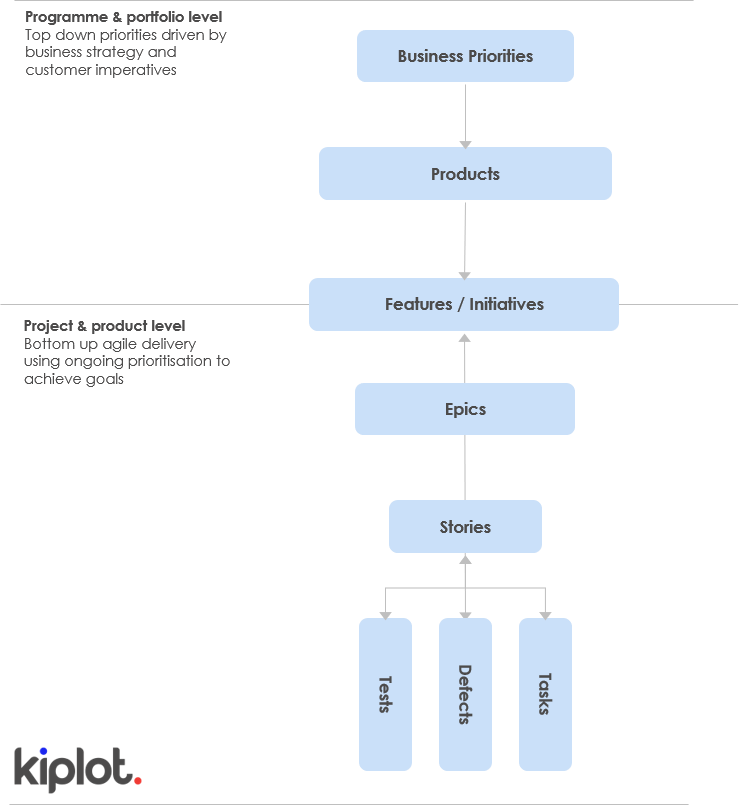
Agree your workflow we strongly recommend starting very simple to begin with. It’s no problem if different teams have different workflows (we would expect and encourage this), but make it simple, at least to begin with.
A good starting point would be, “Backlog”, “In analysis”, “In design”, “Ready for development”, “QA" and “Done”.
Use ‘Statuses’ to track the state of each issue in the workflow, rather than creating separate stages. i.e. “Blocked” or “Ready to deploy”.
Tip 2: Introduce a pre-backlog stage
As your teams begin to bed-in the basics, we recommend introducing a pre-backlog stage. You can call this “Not Yet Prioritised” or “Not Groomed” but this is essentially a dumping ground for all the tickets that have not yet been reviewed by your product owner.
The reason for the two-tier system is to cut out some of the noise at the portfolio level. It is important to separate the tickets that have been reviewed, from tickets that might have been accidentally raised, duplicative tickets, unestimated work and ill-thought-through feature ideas. It means that when you consider your “backlog”, you know that everything in it has at least had a cursory glance from the Product Owner.
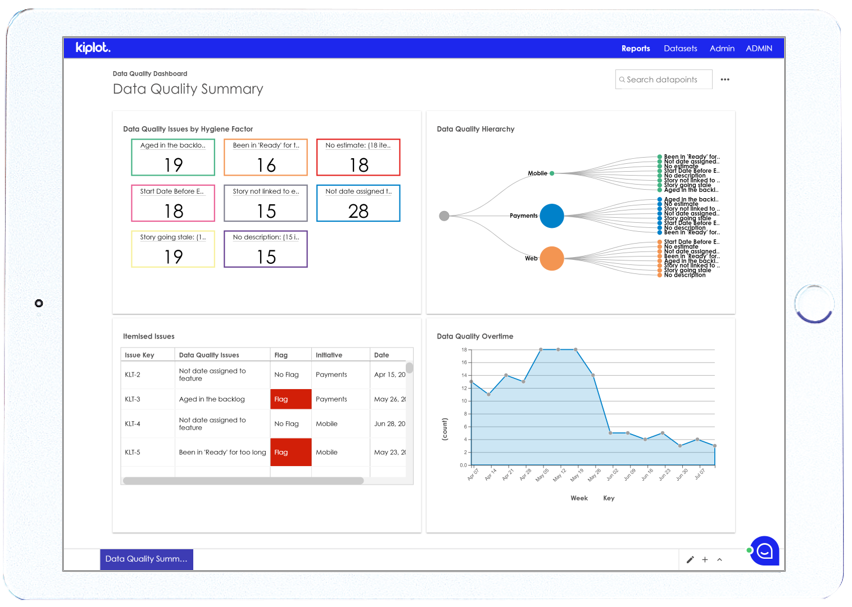
Tip 3: Monitor, drive and reward data quality
This is our most obvious tip, but we are amazed by how unusual it is for teams to actively monitor data quality. You should pick your most important data quality bugbears, and track them.
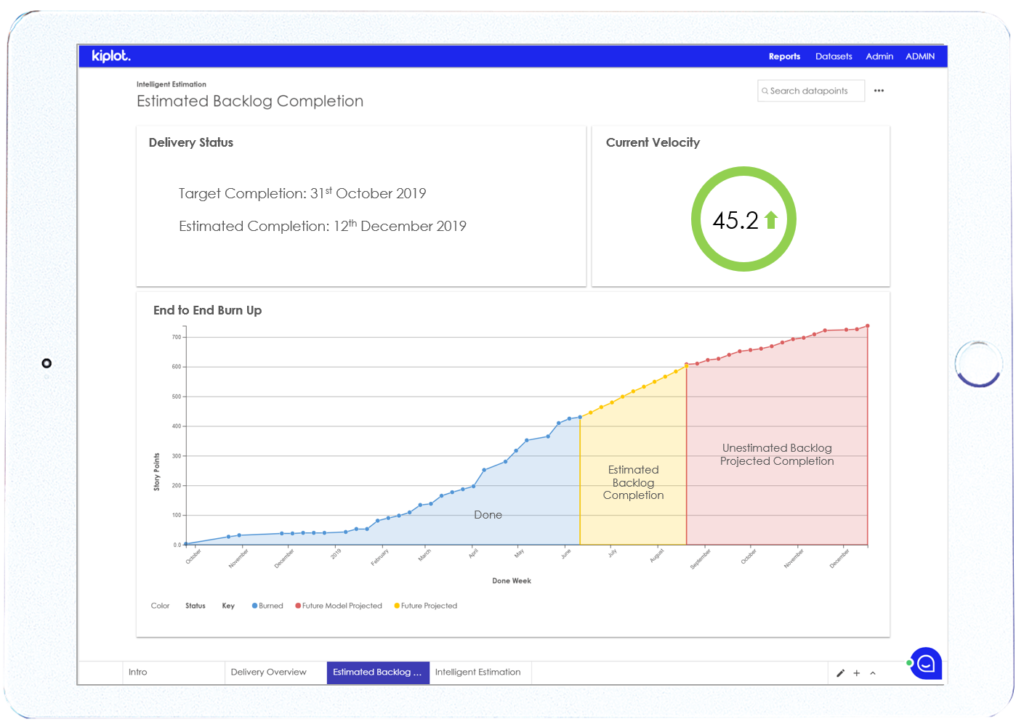
Tip 4: Use historical data to forecast the future
“Past performance is not an indicator of future results” - so goes the FCA enforced guidance on most financial services products. However, in the context of your delivery capability, it is an excellent framework to determine your best, worst and likely outcomes, for the delivery of any given scope.
There are a number of different approaches you can take here. They start with a relatively low level of complexity and grow to a huge degree of maturity for large engineering teams that have been working for years.
As a starting point looking at a combination of historical velocity, throughput and lead-time per person, per component, per product - as well as looking at the nature of the issue (i.e. issue type, who raised the bug, how long did it spend in the backlog, how long in design)
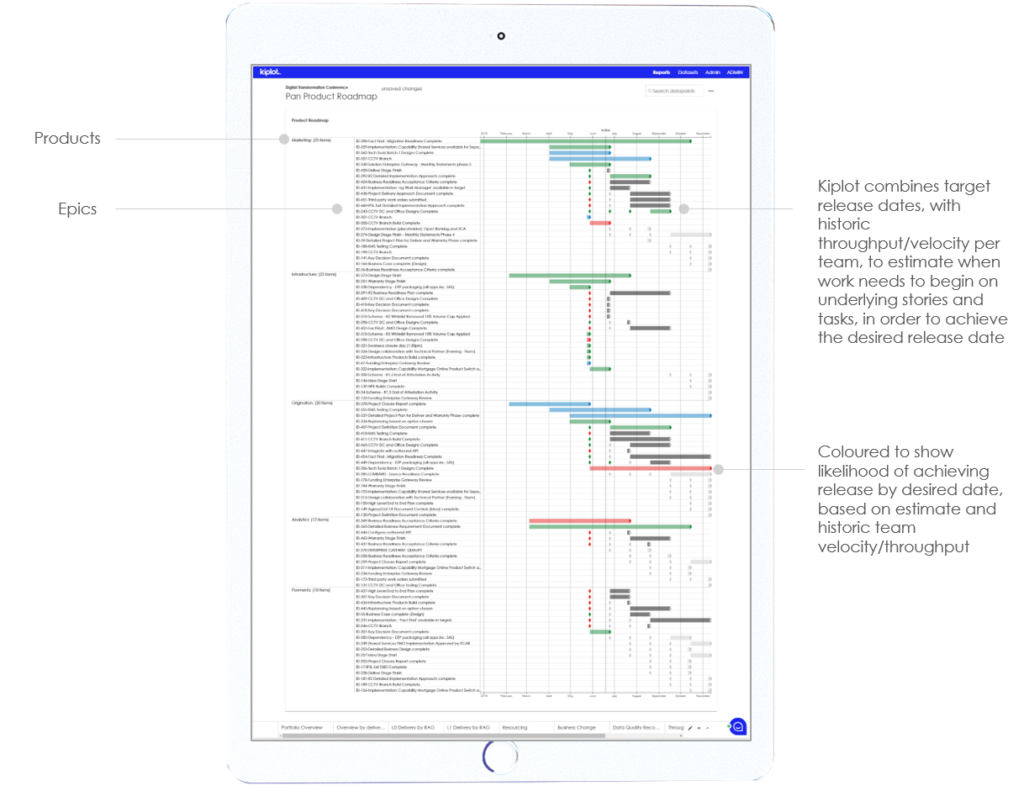
Tip 5: Visualise your roadmap
This is key to understanding what’s really going on. Gantt charts have a bad reputation amongst agile practitioners, but a visual representation of where you’re going, and your progress towards it is the single most useful way to understand your delivery narrative.
You don’t have to call it a Gantt chart… even if it does often look a little bit like that!
It’ll also help to motivate your team. Chomping through tickets can sometimes feel like you work on a help desk, solving one issue at a time. But seeing this in the context of a broader plan will help your team understand how the work they are doing contributes to the broader vision.
You can also use Kiplot to overlay delivery analytics onto your roadmap to tell you how the team is doing.
At Kiplot we are focused on helping our clients make sense of JIRA and other project execution systems. Would you like to see more? Drop us a note at hello@kiplot.com