Introduction
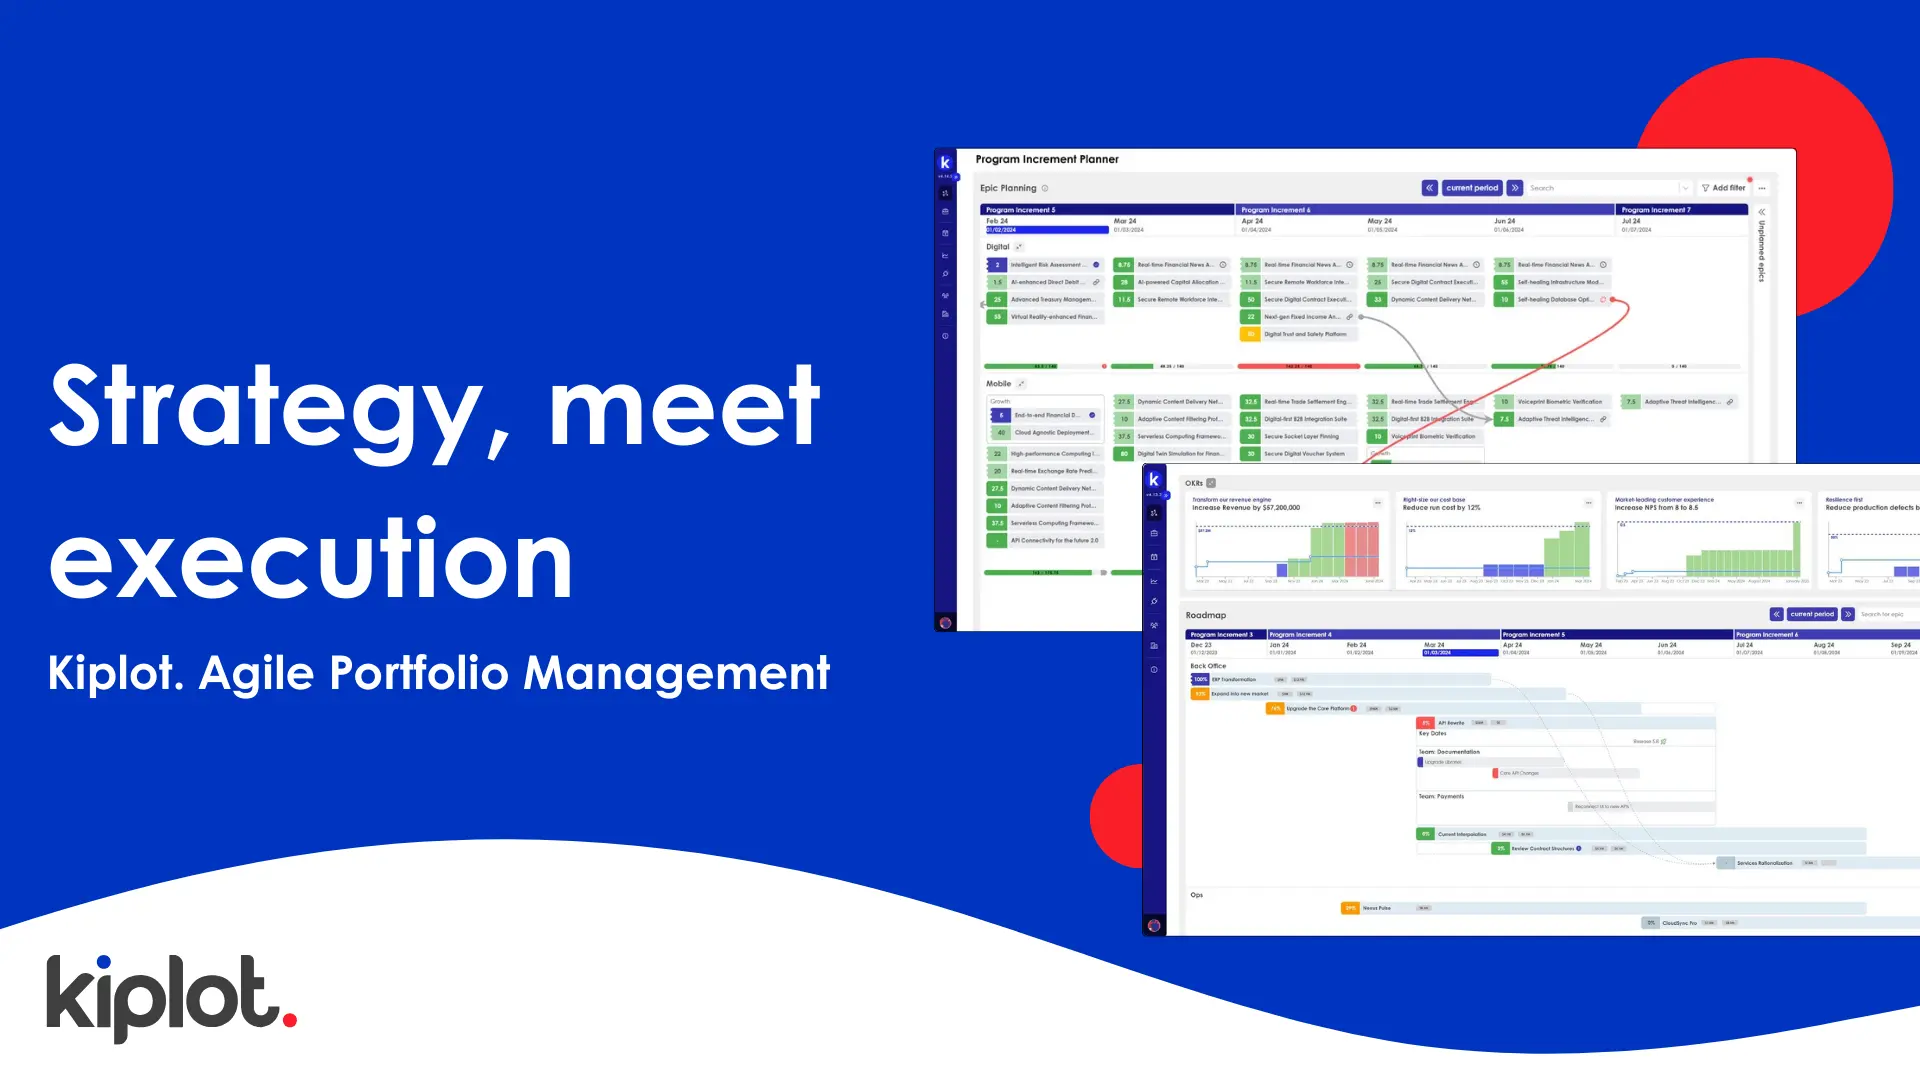
Today's market leaders understand that effective progress reporting creates a clear line of sight from boardroom strategies to frontline execution. Too often, status reports become ceremonial PowerPoint decks, sanitized through organizational hierarchy—disguising the very information needed to identify issues, trigger interventions, and stay on track. The most successful organizations have transformed reporting from periodic health checks into dynamic flows of actionable data that provide real-time visibility into how initiatives drive organizational value, from tactical wins to strategic benefits. This article breaks down the essential components of best-in-class enterprise progress reporting, from foundational practices to industry-leading approaches. We'll explore how to transform traditional PMO reporting into a mission control center that cuts through organizational noise to reveal what needs attention. By connecting initiatives to strategic outcomes, organizations can focus their resources where they'll deliver maximum value—ensuring every hour spent and dollar invested drives results.
Where to start — brilliant basics
Getting the basics right starts with standardization – the foundation upon which all effective reporting is built. Without consistent reporting structures and metrics, organizations leave room for selective interpretation and cosmetic improvements that mask underlying issues. Standardization isn't just about format – it's about creating a common language that enables data-driven insights and genuine transparency. The table below outlines the core components every basic report should include, establishing the framework that will ultimately connect each reporting component, directly to a system of record.
| Report component | How to get it right |
|---|---|
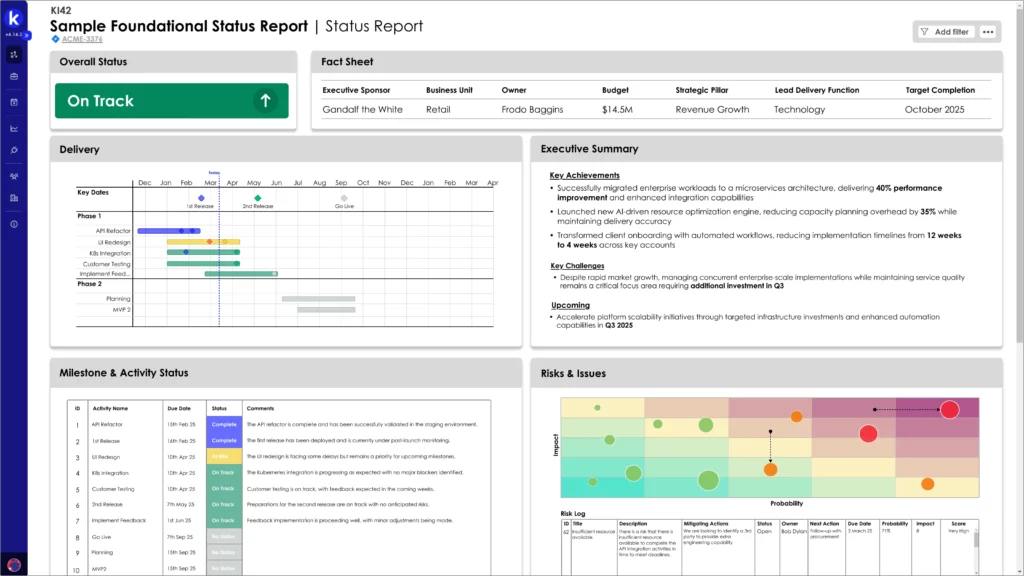
| Fact Sheet | This component forms the cornerstone of effective reporting. A well-structured fact sheet contains all essential initiative information in a standardized format. <ul> <li> Establishes a single source of truth for stakeholders across the organization <li> Creates alignment on critical data points that define the initiative <li> Serves as the foundation for consistent, data-driven reporting practices </ul> |
| RAG | The RAG (Red, Amber, Green) status provides essential visibility into initiative health. <ul> <li> Delivers immediate visual understanding of status for executive-level reviews <li> Begins with a single, focused indicator before expanding to more granular assessments <li> Eliminates ambiguity by standardizing what constitutes each status level </ul> |
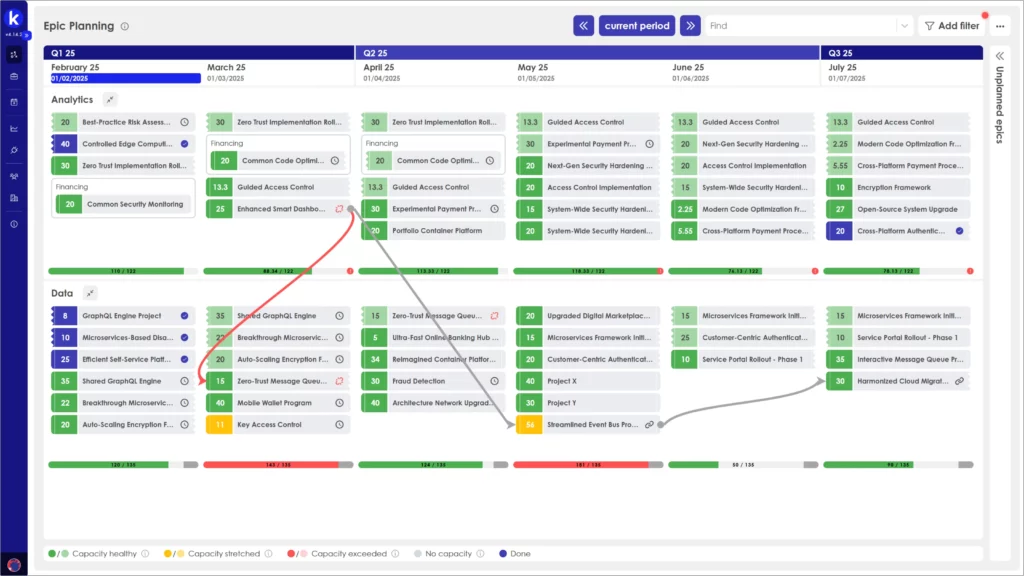
| POAP / Key Dates | Plan-on-a-Page reporting must be anchored in reliable data, not manual manipulation. <ul> <li> Transitions teams from labor-intensive PowerPoint updates to automated data visualization <li> Maintains strategic focus on critical milestones and dependencies <li> Creates a consistent framework for timeline assessment and accountability </ul> |
| Risks & Issues | A structured approach to risk and issue management differentiates high-performing organizations. <ul> <li> Implements clear escalation pathways that ensure visibility at appropriate levels <li> Prevents critical issues from remaining hidden within departmental silos <li> Enables proactive mitigation strategies based on standardized risk assessment </ul> |
| Qualitative Status Report | The narrative component of reporting gains power through standardization and data support. <ul> <li> Leverages AI capabilities to generate consistent, objective status narratives <li> Complements quantitative metrics with essential business context <li> Establishes organizational standards for what constitutes effective status communication </ul> |
Building on the foundations — advanced reporting
Moving beyond the basics requires a strategic, methodical approach. Attempting to implement every advanced reporting component simultaneously often leads to organizational resistance and inconsistent adoption. Instead, successful enterprises develop a phased roadmap that introduces each sophisticated element in sequence, allowing for proper integration and capability building.
This section outlines how to elevate your reporting from functional to advanced, detailing the key components that distinguish market-leading organizations. We'll explore both the implementation approach and the transformative impact each element delivers when properly executed. By following this progressive framework, you'll create a reporting ecosystem that not only tracks progress but actively drives strategic outcomes.
| Report component | How to get it right |
|---|---|
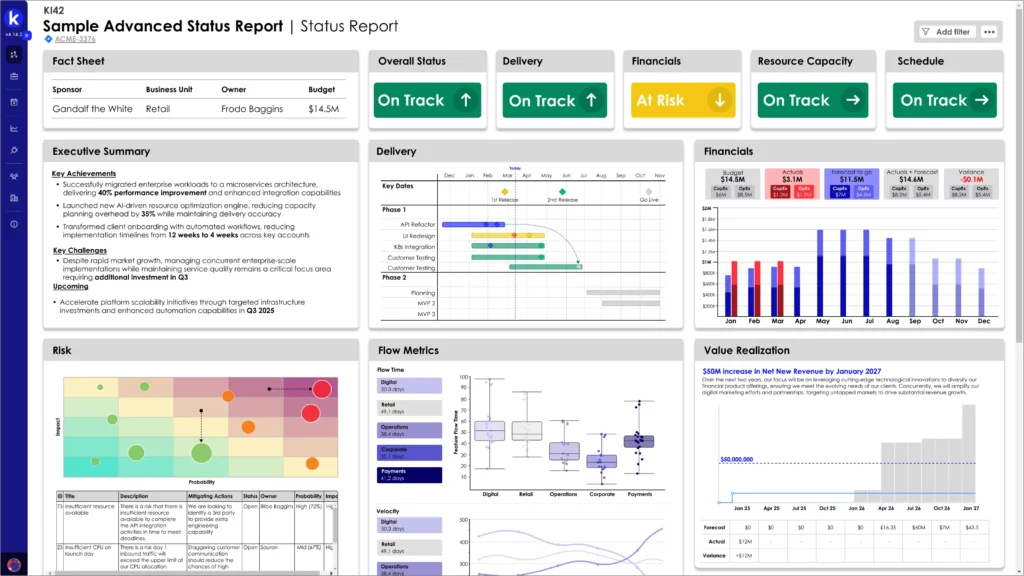
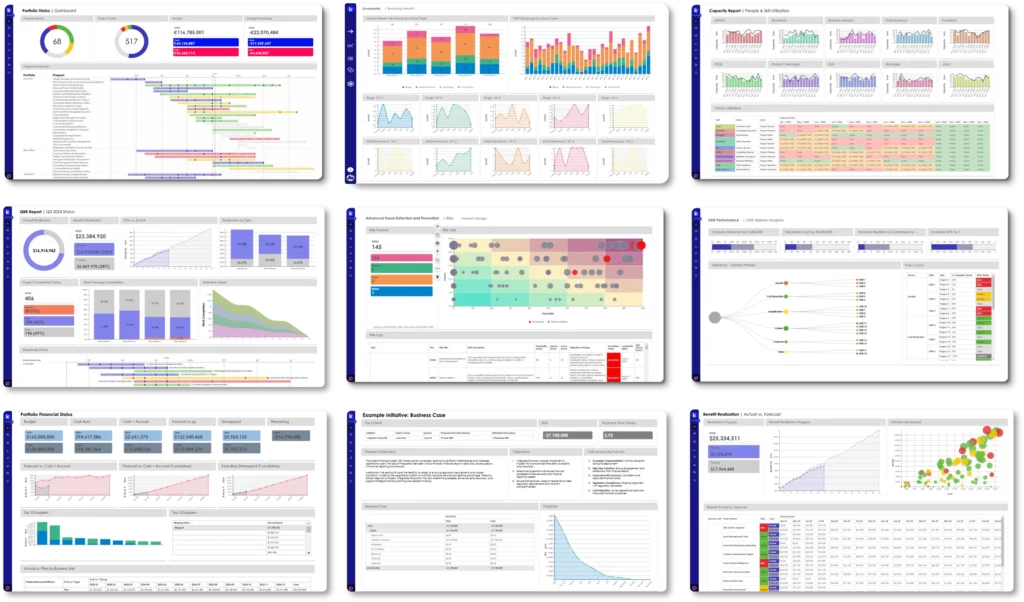
| Financial Performance | Effective financial tracking forms the backbone of strategic decision-making and resource allocation. <ul> <li>Budget, forecast, actual, and accrual metrics should flow directly from your ERP/accounting system (SAP, Oracle) with minimal manual intervention <li>Clearly distinguish between CapEx and OpEx spending to maintain alignment with financial governance <li>Incorporate time-tracking data from resources to accurately reflect internal costs as part of actual expenditure <li>Enable drill-down capability from summary metrics to transaction-level details for transparency and auditability </ul> |
| Flow metrics | Flow metrics provide visibility into delivery effectiveness, particularly crucial in agile and cross-functional environments. <ul> <li>Track team velocity to understand capacity and predict future delivery timelines <li>Measure flow time to identify bottlenecks and optimize value stream efficiency <li>Monitor lead time to set realistic expectations and improve customer satisfaction <li>Standardize these metrics across teams to enable meaningful comparisons and identify best practices <li>Connect development metrics to business outcomes to demonstrate the impact of delivery performance </ul> |
| Value Realization | Value tracking closes the loop between investment and return, validating business case assumptions. <ul> <li>Quantify benefits in dollar terms, including both revenue generation and cost savings <li>Establish direct connections between initiative outcomes and strategic OKRs <li>Compare forecasted benefits from original business cases against actual realized value <li>Implement leading indicators that predict value realization before financial impact materializes <li>Create accountability by tracking value realization long after implementation is complete </ul> |
Beyond status reporting — strategic intelligence
Moving from advanced to industry-leading reporting capabilities represents a fundamental shift in how organizations view delivery coordination. At this level, reporting transcends simple status updates to become an integrated operational nerve center. Modern delivery coordination teams (PMOs, APMOs, and LPM functions) evolve from administrative oversight to strategic enablement, leveraging sophisticated data integration and predictive analytics to drive organizational performance.
The capabilities outlined below exist outside traditional status reporting but form the ecosystem that enables truly data-driven decision-making. Organizations that master these elements gain significant competitive advantages through enhanced resource optimization, risk mitigation, and value acceleration.
Resource Utilization
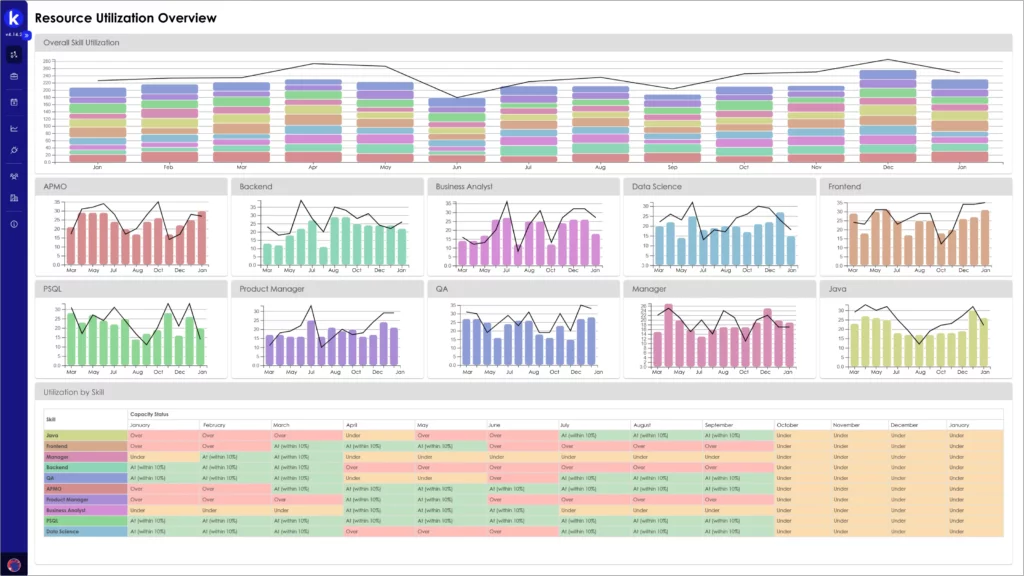
Sophisticated resource management provides unparalleled visibility into capacity, capabilities, and allocation effectiveness.
- Team, Skill, and Individual Tracking: Granular visibility across multiple dimensions enables precise matching of capabilities to initiative needs
- Estimate vs. Actual Analysis: Continuous comparison of planned versus actual utilization drives improved estimation accuracy and highlights process inefficiencies
- Predictive Capacity Modeling: Advanced analytics forecast future capacity constraints based on historical patterns and upcoming demand
- Cross-Functional Allocation Optimization: Holistic view across departmental boundaries allows for dynamic resource reallocation to highest-value initiatives
Dependencies
Comprehensive dependency management transforms a common point of failure into a strategic advantage.
- Automated Extraction from Delivery Systems: Direct integration with tools like Jira and Azure DevOps eliminates manual dependency tracking
- Cross-Initiative Dependency Mapping: Visualization of interconnections across the enterprise portfolio highlights critical paths and potential bottlenecks
- Impact Analysis and Simulation: Ability to model the cascading effects of schedule changes before implementation
- Early Warning Systems: Automated alerts when upstream dependencies are at risk of missing deadlines
Bugs and Defects
Quality metrics integrated directly from development environments provide leading indicators of delivery risk.
- Real-Time Integration with Issue Tracking: Direct connection to Jira and similar platforms for immediate visibility into quality trends
- Severity and Impact Classification: Standardized categorization to prioritize defects based on business impact
- Defect Escape Analysis: Tracking where in the delivery process defects are introduced versus discovered
- Technical Debt Quantification: Measurement of accumulated quality issues in financial terms to support investment decisions
Customer/Stakeholder Feedback
Connecting delivery metrics to customer experience creates a closed feedback loop for continuous improvement.
- Integrated Satisfaction Measurement: Direct incorporation of NPS, CSAT, and other experience metrics into delivery reporting
- Feature-Level Adoption Tracking: Granular usage analytics tied to specific capabilities to validate value delivery
- Voice of Customer Integration: Qualitative feedback systematically collected and categorized to inform priorities
- Experience vs. Delivery Correlation: Analysis of the relationship between delivery metrics and customer experience indicators
Governance, Guardrails and Compliance
Transforming governance from a control function to an enabler of speed with appropriate safeguards.
- Automated Compliance Verification: Continuous monitoring against regulatory, security, and policy requirements
- Policy as Code: Programmatic implementation of governance requirements to enable automated verification
- Risk-Based Governance Approach: Tailored oversight based on initiative risk profile and organizational impact
- Governance Performance Metrics: Measurement of governance effectiveness in terms of both protection and enablement
Industry leaders recognize that these capabilities require significant investment in data integration, analytics capabilities, and organizational change. However, the return comes through dramatically improved decision quality, resource optimization, and ultimately, competitive advantage in bringing new capabilities to market faster and with higher quality.