Introduction
Agile methodologies have become indispensable for organizations aiming to navigate complexity and foster innovation whilst continuing to deliver predictable value. Yet, despite widespread adoption of agile principles into contemporary ways of working, a significant gap remains in understanding the specific meaning of critical metrics that tell the story of an organization’s agile transformation.
Organizations that are further towards the ‘north star’ goal of agile maturity are able to eliminate ad-hoc reporting and imprecise estimations by establishing metrics frameworks that offer clear, actionable insights into their agile transformation.
In this article, we explore the critical metrics that define success in agile environments, providing detailed examples and step-by-step breakdowns of calculations.

From understanding team velocity to measuring customer value, this guide covers essential metrics that agile organizations need to maintain control, drive innovation, and accelerate delivery.
Remember, you can use the menu on the right hand side to easily and quickly navigate through the article.
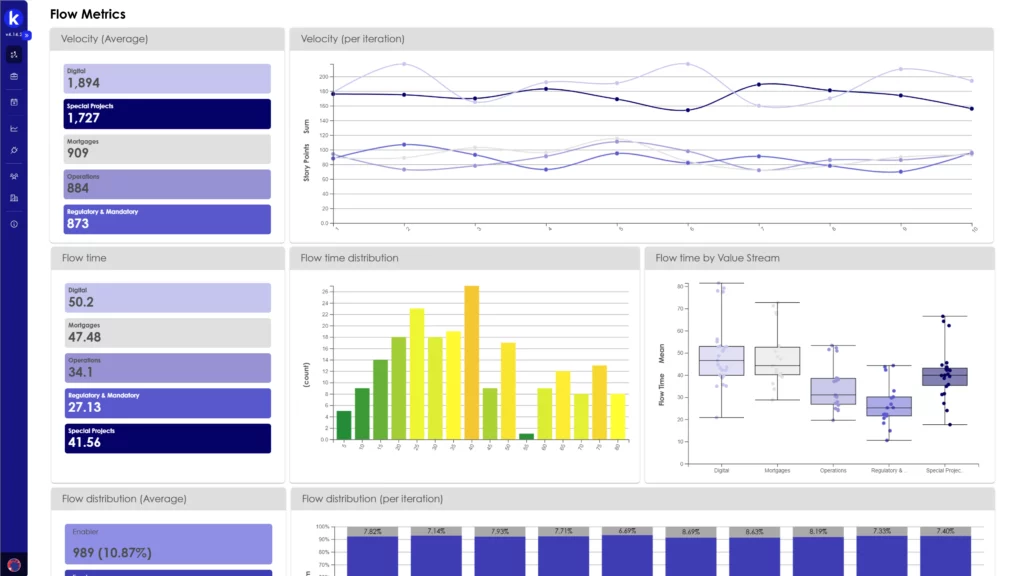
Flow Metrics
Flow metrics provide critical insights into the efficiency of the workflow, helping teams identify bottlenecks and optimize processes for better productivity and delivery speed.
Work In Progress (WIP)
WIP tracks the number of work items currently in progress at any given time. It helps manage workload and avoid overcommitment.
To calculate WIP, count the number of work items in the "In Progress" stage of your workflow.
Formula:

Example:
- If there are 5 tasks being worked on simultaneously, the WIP is 5.
Formula:

Monitoring WIP helps teams maintain a sustainable pace, ensuring that work items are completed efficiently before new items are started.
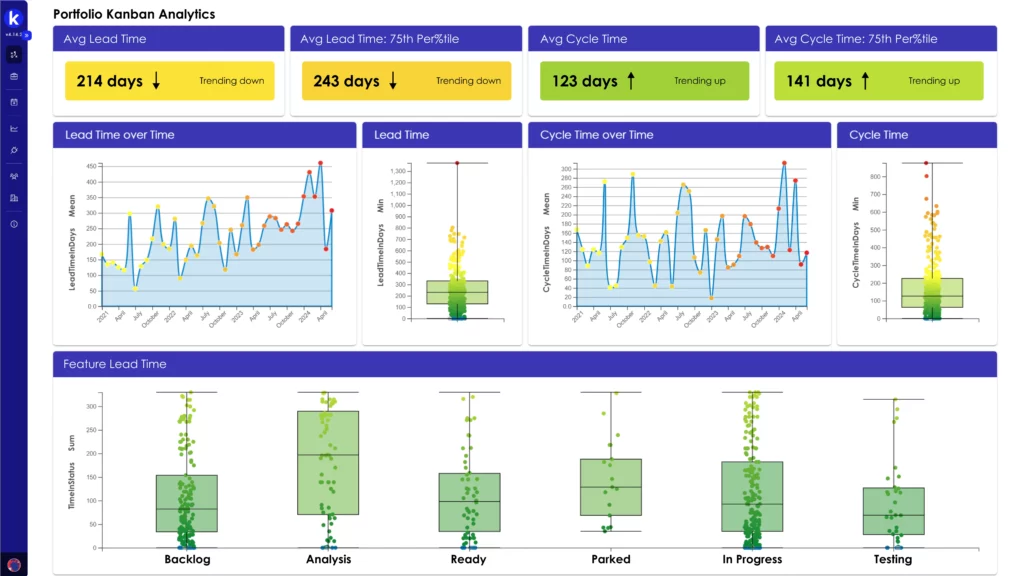
Lead Time and Cycle Time
Lead time is the total time taken from receiving a request to delivering the product.
Formula:

Cycle time is the time taken to complete a specific task from when work starts to when it is finished.
Formula:

Both metrics are calculated using the timestamps of the work items.
Example:
Lead Time Calculation:
- Request Received: January 1
- Product Delivered: January 10
Formula:

Cycle Time Calculation:
- Work Started: January 3
- Work Completed: January 8
Formula:

By monitoring lead time and cycle time, teams can identify bottlenecks and streamline processes to improve overall efficiency. For instance, if the average lead time is 15 days but the cycle time is only 7 days, it indicates delays before work begins. Addressing these delays can reduce the lead time and improve delivery speed.
Throughput
Throughput measures the number of work items completed in a given time period, reflecting the team's delivery capacity.
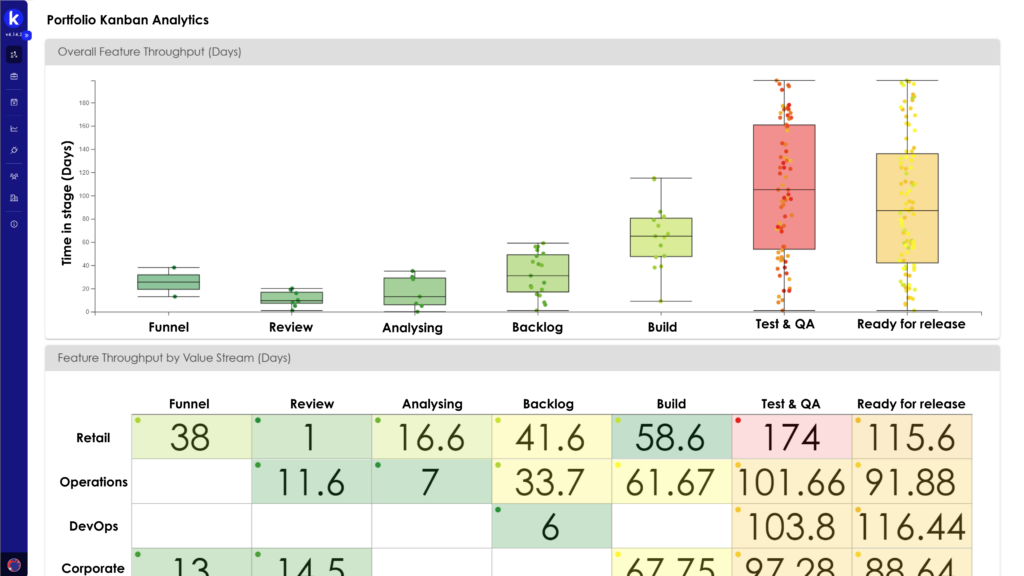
Throughput is calculated by counting the number of completed work items in a specific period (e.g., per week or per sprint).
Formula:

Example:
- In a two-week sprint, the team completes 15 tasks.
Formula:

Increasing throughput indicates improved team productivity and capacity.
Flow Efficiency
Flow efficiency measures the ratio of active working time to total elapsed time for work items, highlighting the time spent actively working versus waiting.
Flow efficiency is calculated using the following formula.
Formula:

Example:
- Total elapsed time for a task: 10 days.
- Active work time: 6 days.
Formula:

Higher flow efficiency indicates a more streamlined process with less time spent in queues or waiting.
Core Agile Metrics
Core agile metrics focus on measuring team performance and project progress. These metrics help in understanding the team's capacity, managing resources, and predicting future performance.
Velocity
Velocity is a metric that measures the amount of work a team can complete during a single sprint. It helps in understanding the team's capacity and aids in forecasting future sprint outcomes.
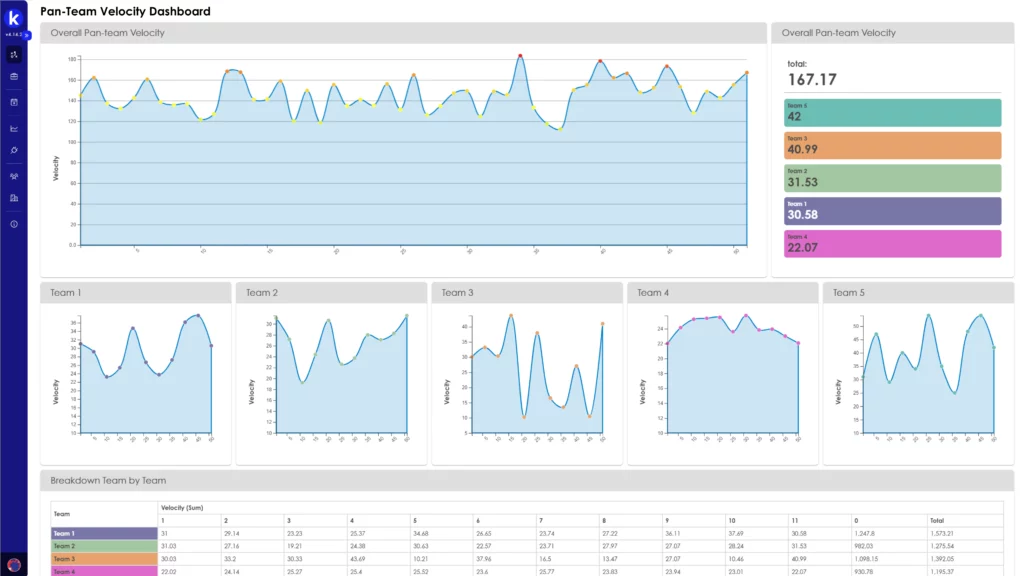
Velocity is calculated by summing up the story points (or any other unit of measure) for all completed user stories in a sprint.
Formula:

Example:
- Sprint 1: 8 story points completed
- Sprint 2: 10 story points completed
- Sprint 3: 9 story points completed
Formula:

This means the team can typically complete around 9 story points per sprint.
If the team has a backlog of 45 story points, they can estimate that it will take approximately 5 sprints to complete the backlog.
Formula:

Burn Rate
Burn rate tracks the rate at which resources (budget or time) are consumed during the project. This helps in forecasting project costs and managing budgets effectively.
Burn rate can be calculated by dividing the total amount spent by the number of time periods (e.g., weeks or months).
Formula:

Example:
- Budget: $100,000
- Time Period: 5 months
- Amount spent in 5 months: $60,000
Formula:

Formula:

Formula:

If the project continues at this burn rate, it will take approximately 3.33 months to exhaust the remaining budget:
Strategic Alignment Metrics
Strategic alignment metrics focus on ensuring that agile efforts are aligned with business goals and outcomes. These metrics measure the value delivered to the customer and the business, as well as the organization's ability to innovate and adapt.
Value Delivered
Value delivered focuses on outcome-based metrics that align projects with business goals. It measures the actual value provided to the customer and the business, such as customer satisfaction and return on investment (ROI).
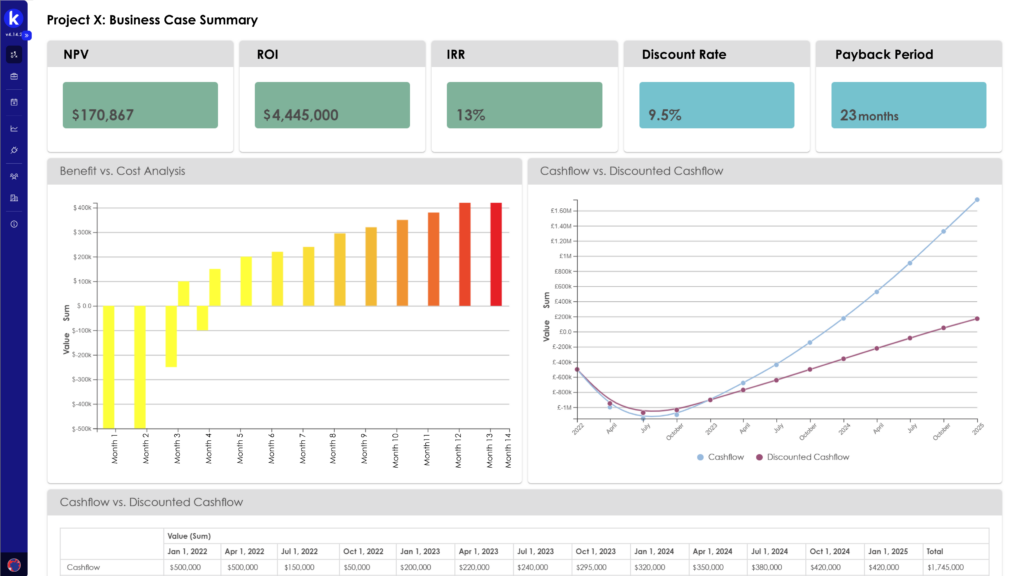
ROI is calculated by dividing the net profit from the project by the total cost of the project and multiplying by 100 to get a percentage.
Formula:

Example:
- Total cost of the project: $200,000
- Net profit from the project: $300,000
Formula:

A 50% ROI indicates that the project has provided significant value relative to its cost. By tracking ROI, organizations can ensure that their agile projects are contributing positively to the business's bottom line and customer satisfaction.
Innovation Rate
Innovation rate measures how often new ideas or products are successfully implemented and their impact on the market or internal processes. It reflects the organization's ability to innovate and adapt to changing conditions.
Innovation rate can be measured by the number of new features or products released over a specific period.
Formula:

Example:
- Number of new features released in a year: 20
- Total number of features at the beginning of the year: 100
Formula:

A 20% innovation rate indicates that the organization is actively introducing new features or products, enhancing its market competitiveness and internal efficiencies. Tracking this metric helps ensure that the organization remains dynamic and forward-thinking.
By consistently tracking these strategic alignment metrics, organizations can ensure that their agile practices are not only efficient but also aligned with broader business goals. This alignment is crucial for achieving long-term success and maintaining a competitive edge in the market.
Quality and Performance Metrics
Quality and performance metrics focus on assessing the quality of the product and the efficiency of the development process. These metrics help in identifying areas for improvement, maintaining high standards, and ensuring customer satisfaction.
Defect Density
Defect density measures the number of defects found in a product relative to the size of the software module or development cycle. It is used to assess the quality of the product and identify areas that may need improvement.
Defect density is calculated by dividing the number of defects by the size of the software (in lines of code, function points, or other size metrics).
Formula:

Example:
- Number of defects: 25
- Size of the software: 10,000 lines of code
Formula:

By monitoring defect density, teams can identify problematic areas of the code that require more rigorous testing or refactoring. Lower defect density indicates higher product quality and can lead to increased customer satisfaction and reduced maintenance costs.
Escaped Defects
Escaped defects are bugs or issues that pass through the testing phase unnoticed and are caught by end-users. This metric helps gauge the effectiveness of the testing process and the overall quality assurance practices.
Escaped defects are calculated by counting the number of defects reported by end-users after the release.
Formula:

Example:
- Number of defects found during development: 40
- Number of defects found by end-users post-release: 5
Formula:

If 5 defects are reported by end-users, this indicates that some issues slipped through the testing phase. Tracking escaped defects helps in identifying gaps in the testing process and improving the overall quality assurance strategy. Reducing escaped defects enhances product reliability and user trust.
By consistently tracking these quality and performance metrics, organizations can ensure that their agile projects maintain high standards of quality, leading to better products and higher customer satisfaction.
Team and Process Health Metrics
Team and process health metrics focus on the well-being of the team and the stability of the processes. These metrics measure team dynamics, morale, and the consistency of performance, ensuring that the team operates efficiently and sustainably.
Team Velocity Variability
Team velocity variability measures the consistency of a team's velocity over time. High variability can indicate instability in the team's process or external disruptions, while low variability suggests a stable and predictable team performance.
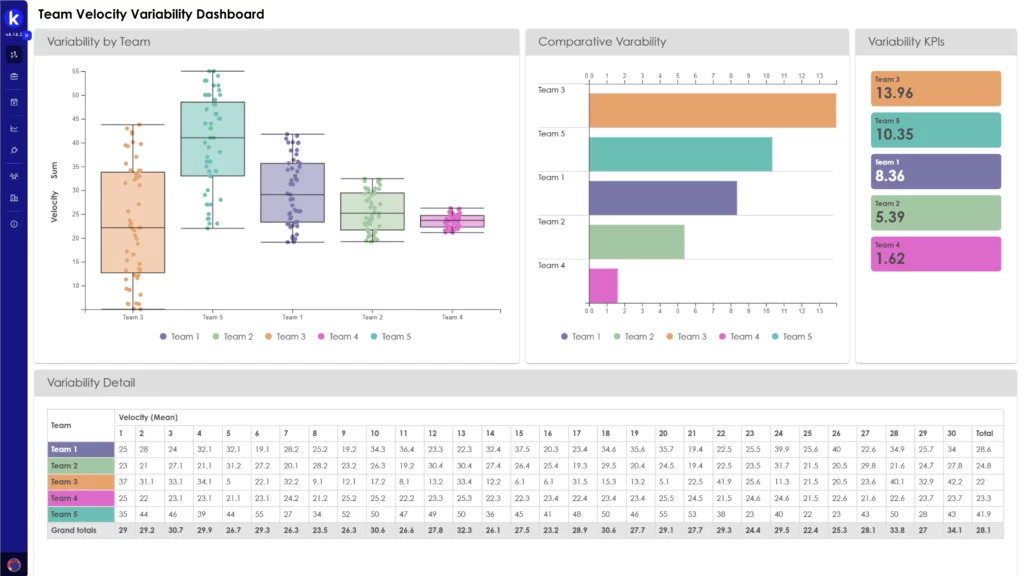
Velocity variability is calculated by determining the standard deviation of the team's velocity over several sprints as follows.
Formula:

Variables:
- V1, V2, … Vn: The velocities in each sprint.
- n: The number of sprints.
Formula:

Variables:
- V1, V2, … Vn: The velocities in each sprint.
- AvgV: The average velocity.
- n: The number of sprints.
Formula:

Variance: The calculated variance from the previous step.
Example:
If the velocities over 3 sprints are 20, 22, and 18 story points:
- Calculate Average Velocity:
Formula:

- Calculate Variance:
Formula:

- Calculate Velocity Variability:
Formula:

A standard deviation of 1.63 indicates relatively low variability in the team's velocity, suggesting a stable process. By monitoring this metric, teams can identify and address factors causing variability, leading to more reliable sprint planning and delivery.
Sprint Burndown
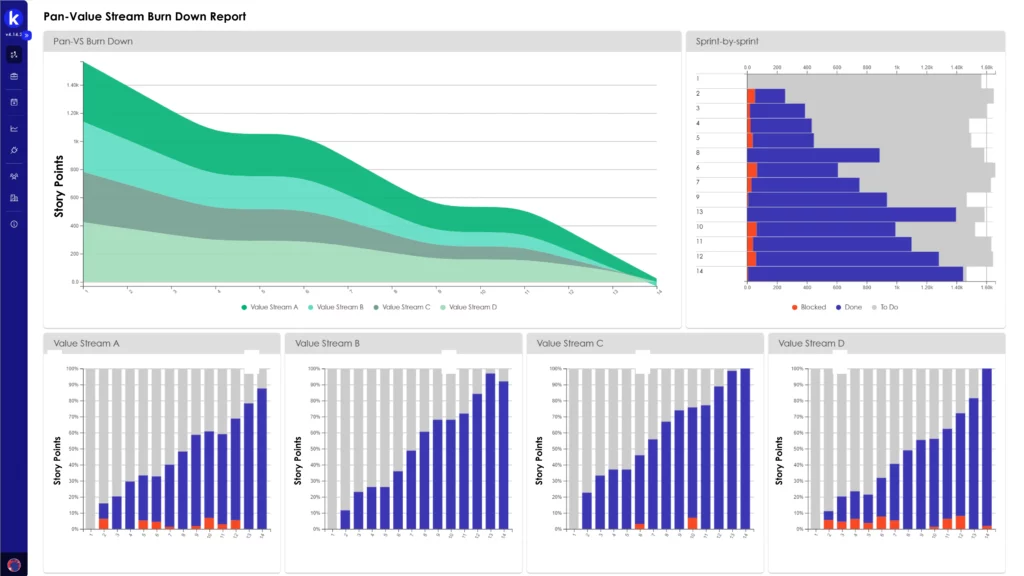
A sprint burndown chart tracks the amount of work completed versus the amount of work remaining in a sprint. It helps teams monitor their progress and make necessary adjustments to stay on track.
To create a sprint burndown chart:
- The vertical axis (Y-axis) representing the amount of work remaining (e.g., story points, hours).
- The horizontal axis (X-axis) representing time (days of the sprint).
Example:
- Sprint length: 10 days
- Total story points: 50
| Day | Story Points Remaining |
| 0 | 50 |
| 1 | 45 |
| 2 | 40 |
| 3 | 35 |
| 4 | 30 |
| 5 | 25 |
| 6 | 20 |
| 7 | 15 |
| 8 | 10 |
| 9 | 5 |
| 10 | 0 |
The chart can be visualized as follows:
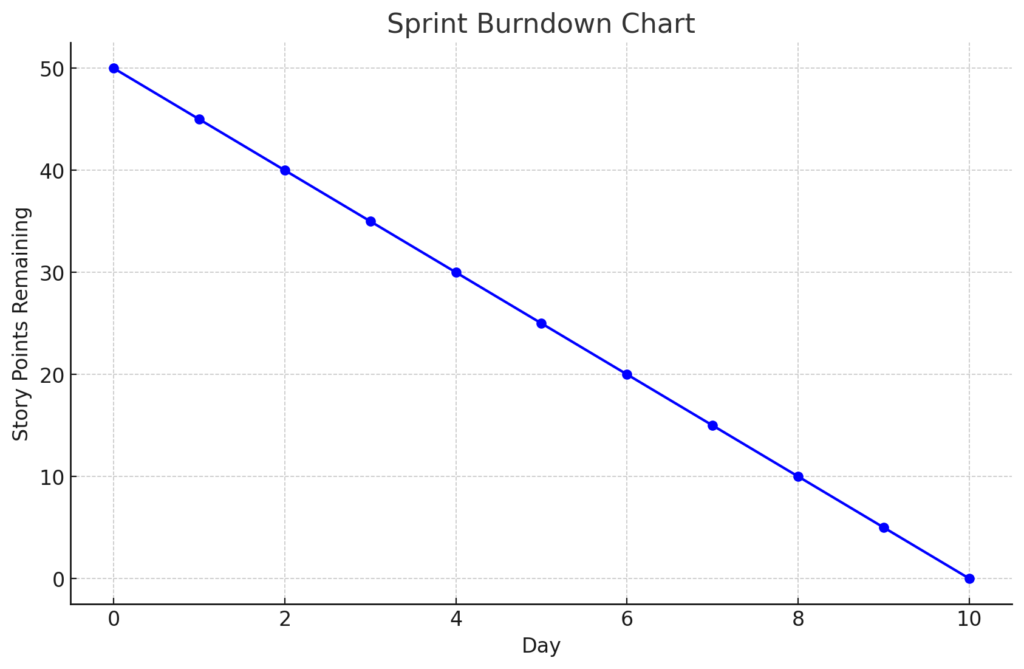
Each day, the team records the remaining story points. If, by day 5, 25 story points remain, the chart shows a steady decline, indicating good progress.
A steady decline in the burndown chart indicates that the team is progressing as planned. Sharp increases or flat lines may indicate obstacles or over-commitment. Regularly reviewing the burndown chart helps teams stay focused and make real-time adjustments to their workload.
Employee Satisfaction
Employee satisfaction measures the morale and well-being of the team members. High satisfaction often correlates with better productivity, collaboration, and retention rates.
Employee satisfaction can be measured through surveys, questionnaires, and direct feedback. Common metrics include eNPS (Employee Net Promoter Score) and average satisfaction scores.
Formula:

eNPS Example:
- Total respondents: 100
- Promoters: 70 (70%)
- Detractors: 10 (10%)
Formula:

Average Satisfaction Score Example:
- Survey Question: "On a scale of 1 to 10, how satisfied are you with your current work environment?"
- Responses: 7, 8, 9, 6, 8
Formula:

An average satisfaction score of 7.6 indicates generally positive morale but also highlights areas for improvement. By regularly assessing employee satisfaction, organizations can implement changes to enhance the work environment, leading to happier, more productive teams.
By consistently tracking these team and process health metrics, organizations can ensure their agile teams are operating efficiently and maintaining high morale, which is crucial for long-term success in agile environments.
Continuous Improvement Metrics
Continuous improvement metrics are designed to measure the effectiveness of processes and identify areas for enhancement within agile teams. These metrics ensure that teams can continuously refine their practices, adapt to changes, and achieve higher levels of efficiency and productivity over time.
Feedback Loops
Feedback loops measure the effectiveness of mechanisms in place for promoting continuous improvement within teams. Effective feedback loops ensure that teams can quickly adapt to changes and improve their processes.
The effectiveness of feedback loops can be measured by the frequency and quality of feedback sessions (e.g., retrospectives) and the implementation rate of the suggested improvements.
Formula:

Example:
- Number of retrospectives held in a sprint: 1
- Number of actionable items identified: 5
- Number of actionable items implemented: 4
Formula:

An 80% implementation rate indicates a strong feedback loop, with most identified issues being addressed. Regularly tracking and improving the feedback loop process ensures that teams are continuously evolving and improving.
Change Lead Time
Change lead time measures how quickly an organization can respond to change requests. This is crucial for maintaining agility and adapting to market or internal shifts.
Change lead time is calculated by measuring the time taken from when a change request is made to when it is fully implemented.
Formula:

Example:
- Change request submitted: March 1
- Change implemented: March 15
Formula:

A change lead time of 14 days shows the organization’s ability to quickly adapt to new requirements. Shorter lead times indicate higher agility, allowing the organization to stay competitive and responsive to customer needs.
By consistently tracking these adaptation and continuous improvement metrics, organizations can ensure they remain agile and responsive to changes, fostering a culture of continuous learning and improvement.
Conclusion
Tracking and understanding key performance metrics is essential for managing and succeeding in agile transformations. By leveraging metrics addressed in the above examples, organizations can gain comprehensive insights into their processes and progress.
These metrics not only help in identifying bottlenecks and inefficiencies but also provide a clear picture of how well teams are aligning with business goals and and the overall progress of an organization’s agile transformation.
Tools like Kiplot can support this integration by providing industry-standard metrics, comprehensive data analysis, and the flexibility to tailor templates to your organization's specific needs. By placing data-driven insight at the heart of your portfolio management functionality – Kiplot seamlessly delivers precise insights that enable organizations to track and measure momentum over time.
Click here to learn more about Kiplot’s custom reporting functionality.