You can’t move forward without data quality. Whether you're delivering strategy, driving execution, or realizing value from your portfolio, none of it works without solid data. Do you want to manage by anecdote, drowning in endless meetings? Or do you want to execute harder, faster, and smarter with cold, hard data that drives results? Data quality is the critical enabler that ensures your initiatives stay on track and deliver measurable outcomes. You need the right talent, the right culture, the right funding—and most importantly, the right data. Without it, your ability to manage portfolios effectively is compromised.
In this article, we explore 6 tactics you can use to unlock quick wins and drive the data quality improvements that will underpin your organization’s success.
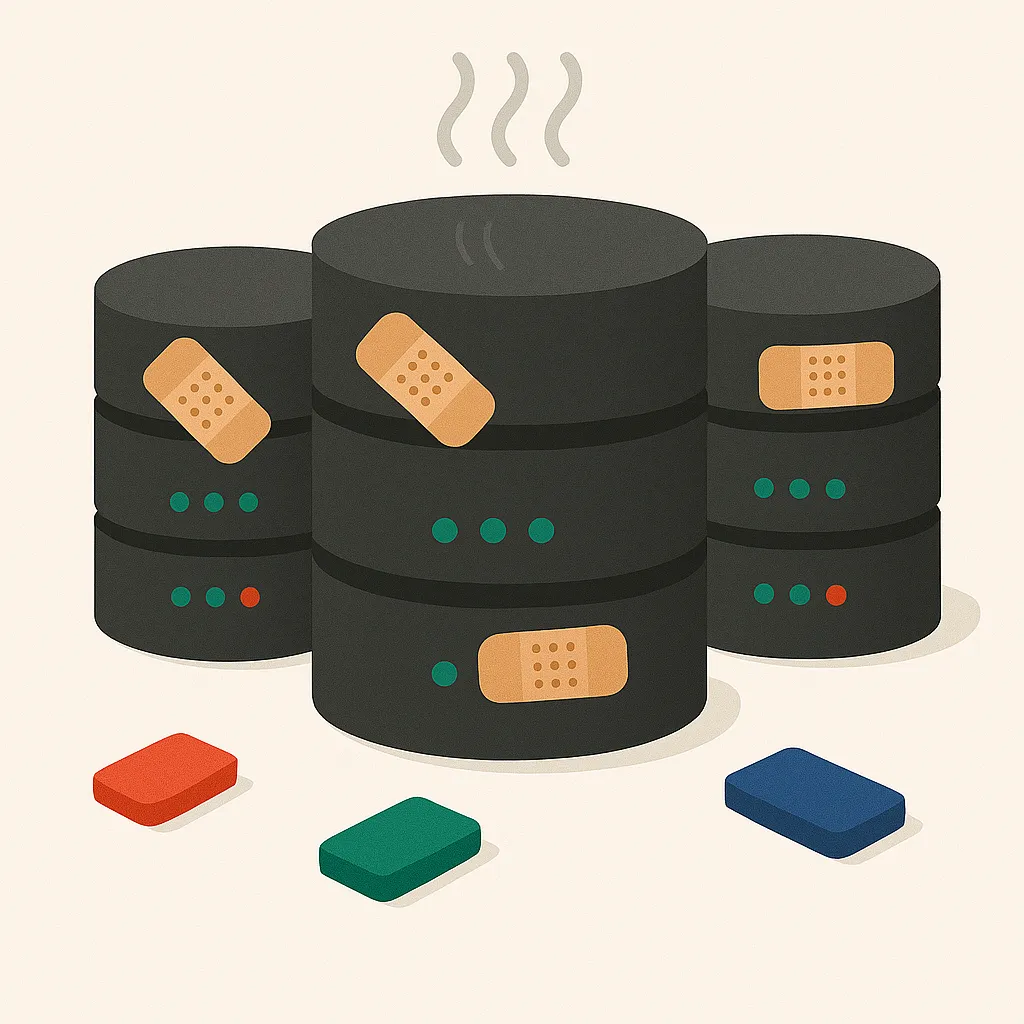
1. Data Quality Score
The first step in improving data quality is to measure it at the foundational level. And no, it’s not about jumping straight to data validity. The very first checks are simple: Is the field populated? How fresh (or stale) is the data?
Many organizations tend to skip this step, thinking about the accuracy or integrity of data before confirming that it actually exists and is up-to-date. Start by testing if the data is available on the entity itself. For example, does an initiative in delivery have a forecast associated with it? Does it have a status report? Is it aligned to a business unit or value stream? These basic questions are essential in making sure that your data is ready for the next steps.
Keep it simple. Start with fields that are easy to track and measure, such as ensuring that a business case must be present for an initiative to be considered in delivery. Once these foundational checks are in place, you can move on to more complex data quality metrics.
Not sure where to start? At the end of this article, we’ll share a starting point for your foundational data quality checks.
💡 Struggling with the right lifecycle for your organization? Check out this article to learn more on this subject.
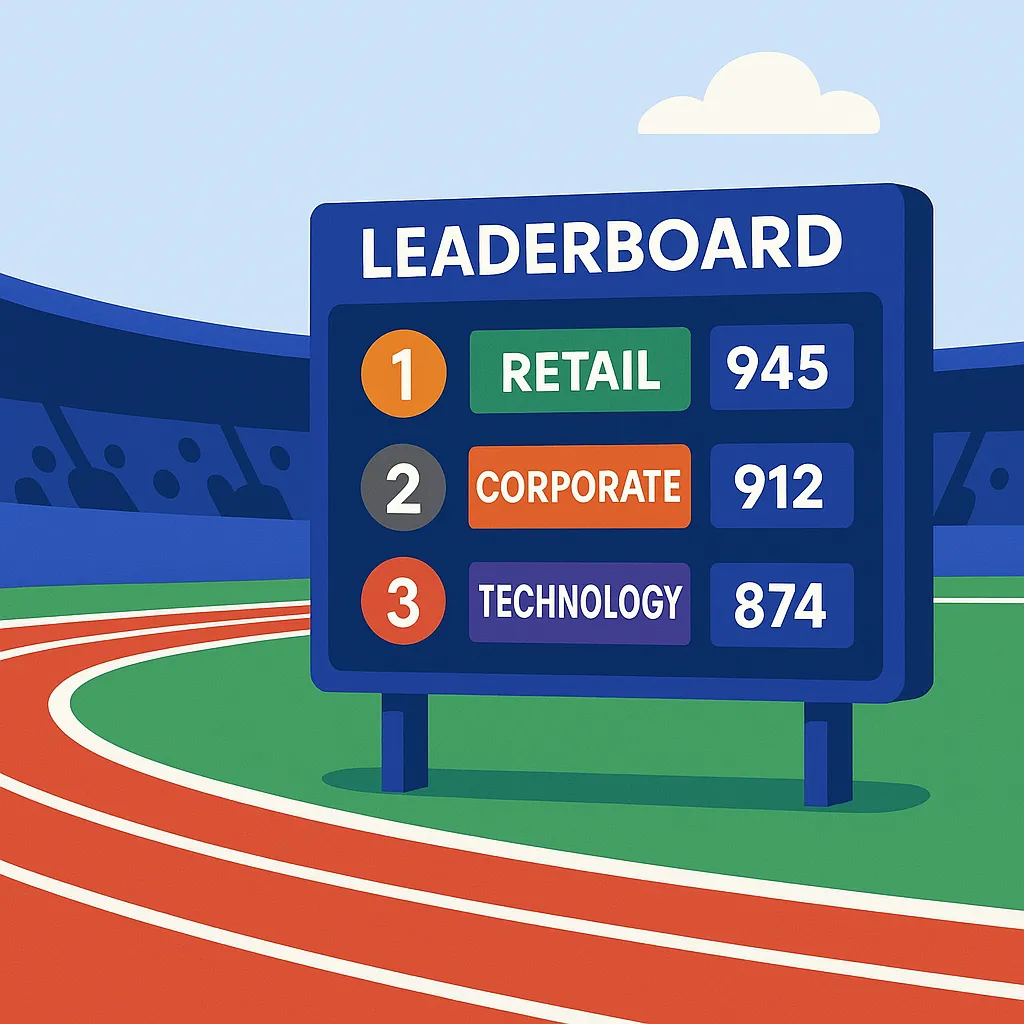
2. Data Quality Leaderboard
Once you’ve established what good data looks like, it’s time to make data quality visible across the organization. A data quality leaderboard encourages accountability and drives engagement by comparing teams’ data quality scores. When employees see how they stack up against others, they’re more likely to take action.
Encourage healthy competition by showcasing real-time scores across different departments or regions. In large, global organizations, this can be especially effective. We’ve seen inter-country competition spur thousands of employees into action, helping to build a global picture of data quality.
But the real key to success here is executive buy-in. Whether it’s during a monthly all-hands meeting or another company-wide forum, get executives to comment on the leaderboard's current status. By making data quality part of the organizational conversation, you give it the focus and importance it needs to drive lasting change.
Poor data quality is as critical as not understanding your financial position. Would you operate a business without trusting your numbers? The same applies to your data.
3. Real-time Data
The era of daily data refreshes is over. If your technology teams are still relying on batch jobs and overnight syncs, it’s time to rethink your data ecosystem. The real problem with non-real-time data is the lack of a feedback loop. You want to update your data and instantly see the impact it has downstream—not wait for the next refresh cycle.
Real-time data is crucial because it enables end users to take immediate action based on the most current information. If your organization’s data is outdated, you're making decisions based on information that's already obsolete. Real-time data allows your teams to react quickly and with confidence, creating a more agile and responsive organization.
Don’t settle for yesterday’s data—demand real-time updates.
4. Less is More
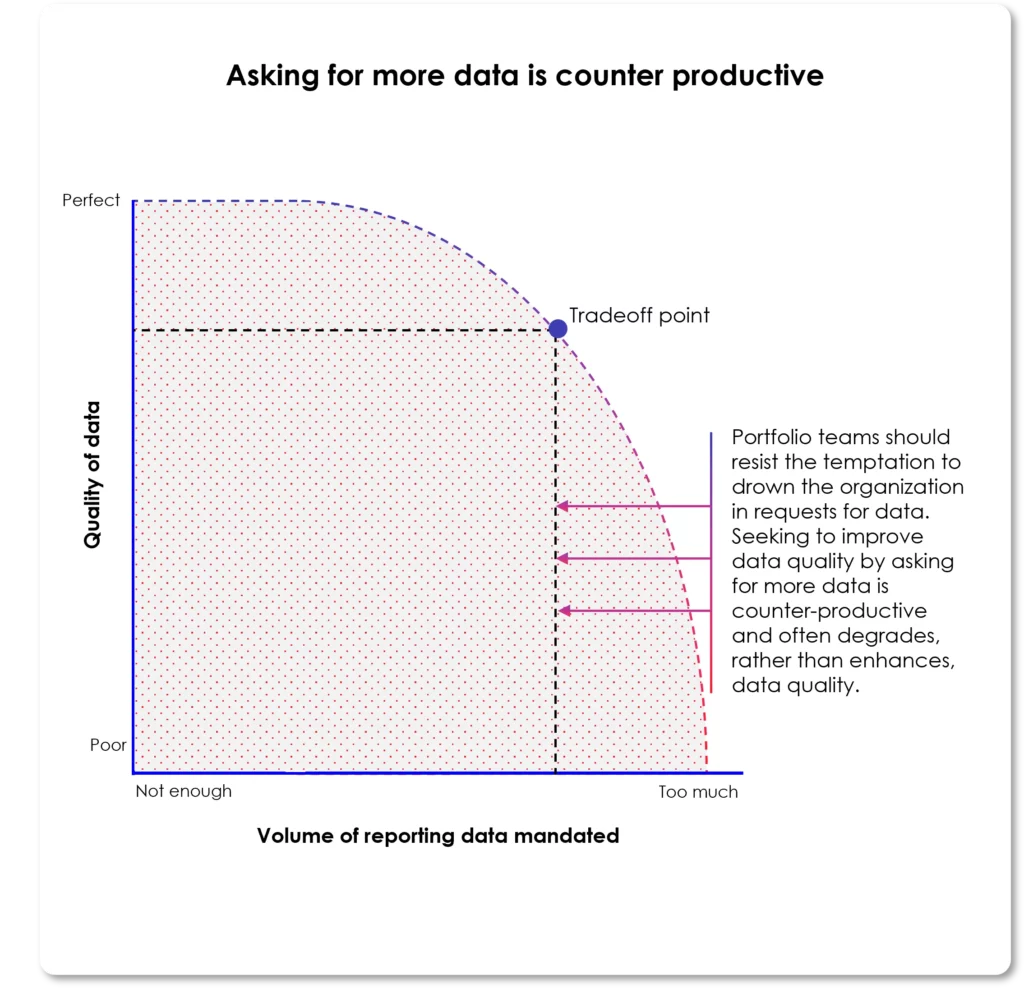
One of the most important lessons when driving data quality is understanding the tradeoff between the volume of data you ask for and the quality of that data. The more data you request, the more likely it is that the quality will suffer. It’s a paradox, but it’s true.
Instead of requesting vast amounts of data, focus on collecting only the most essential and actionable information. Prioritize the data that directly supports key decisions and performance metrics. The result is more reliable, actionable data that your teams can trust to make better decisions.
Check out the chart below to see how asking for more data can lead to diminishing quality. Finding the “Goldilocks” middle ground—where you have just enough data to inform decisions, without overwhelming your teams—is key.
image:medium
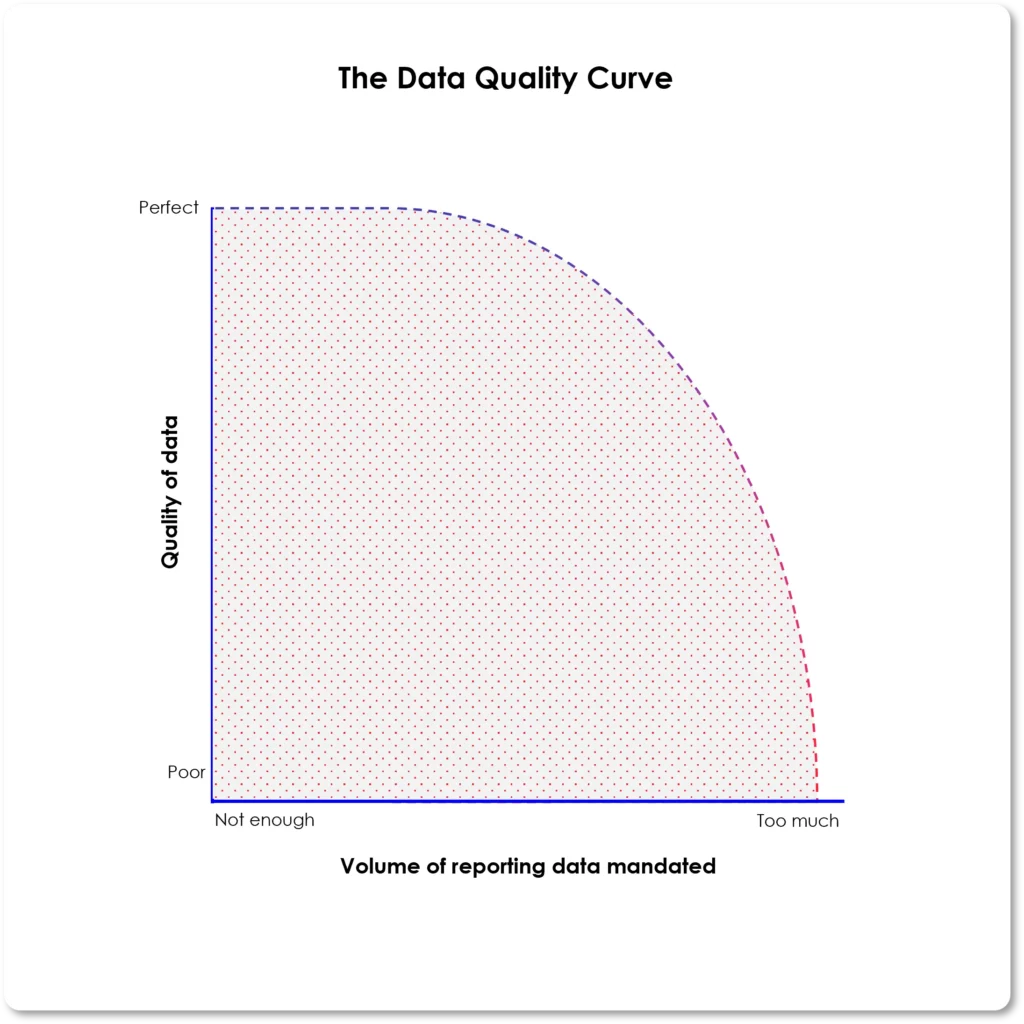
image:medium
5. Data-driven Status Reports
Whether we like it or not, PowerPoint has become a default tool for status reporting. It’s a powerful storytelling device when used correctly, but when it becomes the foundation for decision-making and project updates, it weakens the credibility of your data.
Status reports should be built on facts, not polished slides. You wouldn’t use flashy visuals or color-coded pyramids to explain your financial position, so why rely on them to communicate the status of your initiatives? PowerPoint should complement your data, not replace it.
By eliminating PowerPoint as the primary means of status reporting, you create a clearer, more data-focused culture that drives efficiency. Imagine the time saved if the hours spent creating slides were instead dedicated to decision-making based on real data.
Jeff Bezos famously banned PowerPoint for decision-making at Amazon. It’s time to follow his lead and remove it from your status reports.
6. Connect Data to OKRs
Finally, to truly drive continuous improvement in data quality, link your data efforts to your organization’s objectives and key results (OKRs). When data is connected to OKRs, it directly impacts the performance of the organization. This visibility motivates everyone to ensure their data is accurate and up-to-date.
Real-time data connected to OKRs also provides immediate feedback on how well your teams are performing, driving improvements in data quality. People don’t want to fall short of their goals, and by aligning data quality with OKRs, you're motivating teams to take ownership of their data and strive for better outcomes.
Conclusion
Data quality isn’t glamorous, but it’s essential for any modern, data-driven organization. Without it, your decision-making is based on guesswork, not facts. By following these 5 action-oriented tactics—measuring foundational data quality, fostering competition, insisting on real-time data, removing PowerPoint from status reports, and balancing data volume with quality—you’ll lay the foundation for a more agile, data-driven organization.
Take action now, and watch your organization transform as you make data quality a priority.
Data Quality Score Framework: Starting Point
| Data | Description | Lifecycle Stage | Weighting/Score |
|---|---|---|---|
| Target Start Date | The planned start date of the initiative | Idea | 1 |
| Target End Date | The planned end date of the initiative | Idea | 1 |
| Owner | The person responsible for delivering the initiative | Idea | 2 |
| Business Unit / Value Stream | The business area or value stream the initiative aligns to | Idea | 2 |
| Stakeholders | Key individuals or groups impacted or involved | Idea | 1 |
| Governance Model | Who’s involved in reviewing and progressing the idea | Idea | 1 |
| Target Start Date | The planned start date of the initiative | Analysis | 1 |
| Target End Date | The planned end date of the initiative | Analysis | 1 |
| Business Case | Early thinking around benefits and justification | Analysis | 3 |
| Stakeholders | Further refined stakeholder list with roles | Analysis | 1 |
| Project Scope | Initial articulation of what is in and out of scope | Analysis | 3 |
| Governance Model | Clarified escalation paths and decision-making model | Analysis | 1 |
| Dependencies | Identification of high-level dependencies | Analysis | 1 |
| Business Case | Full articulation of need, value, risks, and alignment | Portfolio Backlog | 3 |
| Approved Budget | The formally agreed funding amount | Portfolio Backlog | 3 |
| Target Start Date | Should now be agreed across governance | Portfolio Backlog | 1 |
| Target End Date | Should now be agreed across governance | Portfolio Backlog | 1 |
| Business Unit / Value Stream | Confirmed allocation | Portfolio Backlog | 2 |
| Project Scope | Final scope definition pre-delivery | Portfolio Backlog | 3 |
| Dependencies | Finalized dependency mapping | Portfolio Backlog | 1 |
| Governance Model | Governance forums and owners in place | Portfolio Backlog | 1 |
| Stakeholders | Accountable/responsible stakeholders confirmed | Portfolio Backlog | 1 |
| Target Start Date | Actual start tracked and visible | Delivery | 1 |
| Target End Date | Used to track delivery progress | Delivery | 1 |
| In-Year Forecast | Expected financials for the year, updated regularly | Delivery | 2 |
| Approved Budget | Budget burn tracked against approval | Delivery | 2 |
| RAG Status | Red/Amber/Green health indicator | Delivery | 2 |
| Tech Owner | Accountable technical lead | Delivery | 2 |
| Risks & Issues | Known blockers and mitigations | Delivery | 1 |
| Change Control Log | Scope, date, or cost changes approved via governance | Delivery | 1 |
| Milestones | Progress tracked via delivery milestones | Delivery | 2 |
| KPIs / Success Metrics | Measures for tracking value being delivered | Delivery | 2 |
| Dependencies | Active monitoring of interlocks | Delivery | 1 |
| Target End Date | Used to verify if initiative completed on time | Value Realization | 1 |
| In-Year Forecast | Final reconciliation of financials | Value Realization | 2 |
| KPIs / Success Metrics | Measurement of outcomes achieved | Value Realization | 2 |
| Milestones | Final milestone delivery assessment | Value Realization | 2 |
| PIR | Initial version of the Post-Implementation Review drafted | Value Realization | 1 |
| Lessons Learned | Preliminary review of what worked and what didn’t | Value Realization | 1 |
| PIR | Formal review of benefits and delivery success | Done | 2 |
| Lessons Learned | Documented for future reference | Done | 1 |
| KPIs / Success Metrics | Final outcomes reported and archived | Done | 2 |
| Target End Date | Used to track closure | Done | 1 |